一通り動かせるようになった。このスクリプトを実行すると、下記のようなローソク足を出力する。
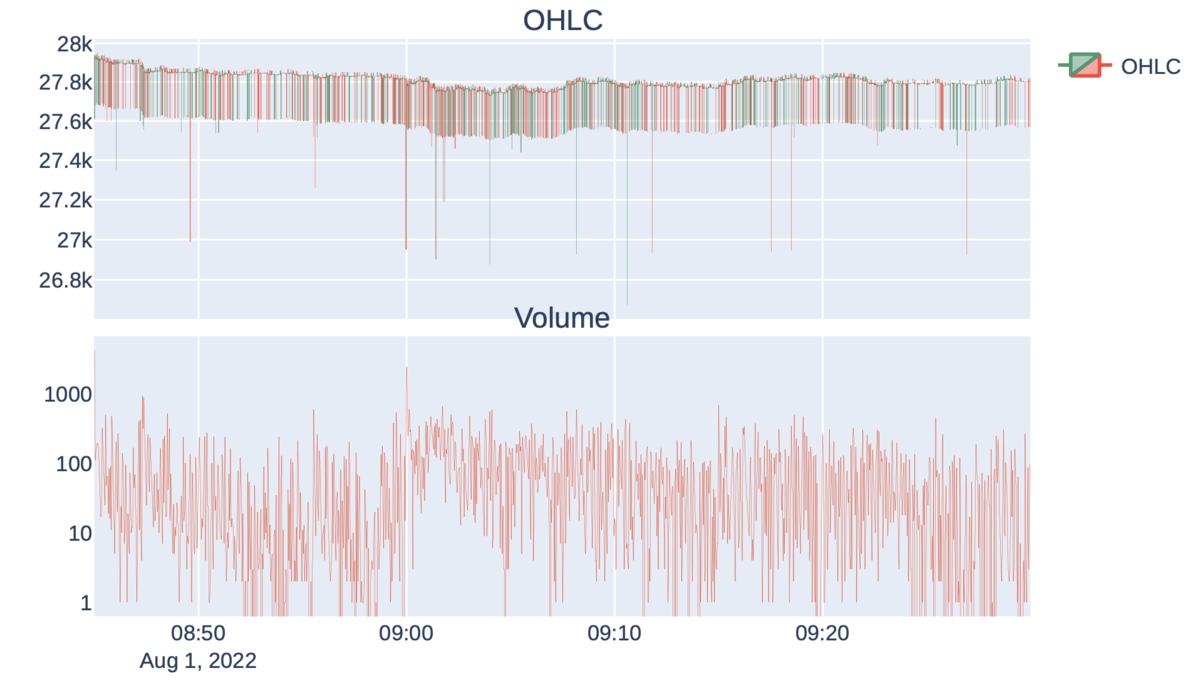
まだ余計なコメントの削除等やることはありつつも、動作するようになったので、一旦全体を公開する。
pip install mplfinance plotly joblib
pip install -U kaleido
# main.py

# %pip install mplfinance
import time
from datetime import datetime
# import seaborn as sns

from tick_data import TickData
from nikkei_225_mini import Nikkei225Mini

# %matplotlib inline

# %pip install plotly
# %pip install -U kaleido

# tips = sns.load_dataset('tips')

# https://note.nkmk.me/python-joblib-parallel-usage/
# %pip install joblib


def main(df):
    td = TickData(
        from_dt=datetime(2022, 8, 1, 8, 30, 0),
        until_dt=datetime(2022, 8, 1, 10, 30, 0),
        df=df,
        output_base_dir='./figures'
    )
    td.export()


DEBUG = True
filepath = './data/日経225mini 歩み値(ティック) (2022 08).zip'
print(f'Load from zip (csv): {filepath}')

t = time.time()
df = Nikkei225Mini.read_from_csv(filepath)
print(f'Load Elapsed: {(time.time() - t):.3f}s')

main(df)
# tick_data.py
from typing import Union, NewType
from datetime import datetime, timedelta
from joblib import Parallel, delayed

import pandas as pd
from pandas import DatetimeIndex

from nikkei_225_mini import Nikkei225Mini
from plotly_candle_stick import PlotlyCandleStick
from separated import Separated

import sys

class TickData:
    DatetimeLike = NewType('DatetimeLike', Union[datetime, DatetimeIndex])
    if sys.version_info.minor >= 10:
        Datetimes = NewType('DateTimes', list[DatetimeLike])
        DatetimeSet = NewType('DateTimeSet', list[tuple[datetime, datetime]])
    else:
        from typing import List, Tuple
        Datetimes = NewType('DateTimes', List[DatetimeLike])
        DatetimeSet = NewType('DateTimeSet', List[Tuple[datetime, datetime]])

    def __init__(self, from_dt: datetime, until_dt: datetime, df: Nikkei225Mini, output_base_dir: str,
                 freq: str = 'H', parallel: bool = False):
        self.from_dt = from_dt
        self.until_dt = until_dt
        self.df: Nikkei225Mini = df
        self.output_base_dir = output_base_dir
        self.parallel = parallel
        self.freq = freq
        self.graph_method: PlotlyCandleStick = Separated

    def _timedelta(self) -> dict:
        if self.freq == 'H':
            return {'hours': 1}
        elif self.freq == 'D':
            return {'days': 1}
        else:
            raise ValueError(f'freq={self.freq} is not supported')

    def _from_to_dts(self) -> Datetimes:
        return [
            [from_dt, from_dt + timedelta(**self._timedelta())]
            for from_dt in
            pd.date_range(start=self.from_dt,
                          end=self.until_dt, freq=self.freq)
        ]

    def _loop_export_procedure(self, dt_set: DatetimeSet):
        from_dt, until_dt = dt_set
        filename: str = str(from_dt)
        data: Nikkei225Mini = Nikkei225Mini(self.df.sort_index().loc[from_dt:until_dt, :])
        if len(data) == 0:
            print(f'SKIPPED: {filename}')
            return
        print(f'STARTED  : {filename}')
        self.graph_method.graph_method(
            data.convert_into_ohlcv('2S'),
            output_base_dir=self.output_base_dir,
            save_fig=True, title=from_dt, filename=from_dt
        )
        print(f'COMPLETED: {filename}')

    def export(self):
        if self.parallel:
            Parallel(n_jobs=-1)([delayed(self._loop_export_procedure)(dt)
                                 for dt in self._from_to_dts()])
        else:
            [self._loop_export_procedure(dt) for dt in self._from_to_dts()]
# nikkei_225_mini.py

import pandas as pd


class Nikkei225Mini(pd.DataFrame):

    @classmethod
    def read_from_csv(cls, filepath: str):
        df = cls._parse_date(
            pd.read_csv(filepath, dtype=cls._dtype())
        )
        return cls(df)

    @classmethod
    def _dtype(cls) -> dict:
        return {
            'trade_date': str,
            'make_date': str,
            'index_type': 'uint8',
            'security_code': str,
            'time': str,
            'trade_price': 'float32',
            'price_type': str,
            'trade_volume': 'uint32',
            'no': 'uint32',
            'contract_month': str,
        }

    @classmethod
    def _parse_date(cls, df) -> pd.DataFrame:
        df.trade_date = pd.to_datetime(
            df.trade_date + 'T' + df.time, format='%Y%m%dT%H%M%S%f')
        df.make_date = pd.to_datetime(
            df.make_date + 'T' + df.time, format='%Y%m%dT%H%M%S%f')
        df.index = df.make_date
        return df

    def convert_into_ohlcv(self, frequency: str) -> pd.DataFrame:
        ohlcv = self.trade_price.resample(frequency).ohlc()
        ohlcv['volume'] = self.trade_volume.resample(frequency).sum()
        return ohlcv
# plotly_candle_stick.py

class PlotlyCandleStick:
    @staticmethod
    def graph_method():
        raise NotImplementedError
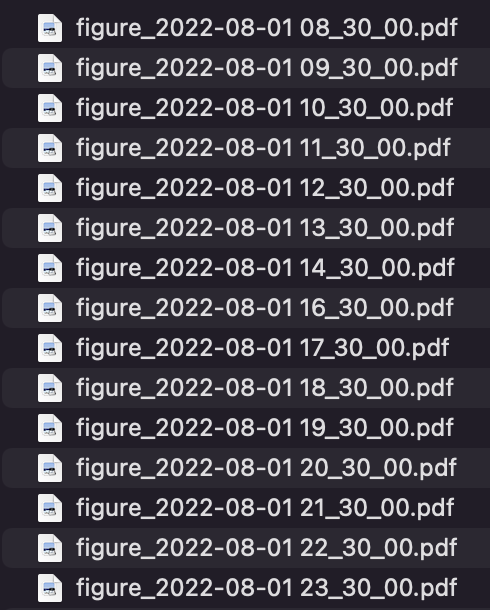
# separated.py

import plotly.graph_objects as go
from plotly.subplots import make_subplots
from plotly_candle_stick import PlotlyCandleStick


class Separated(PlotlyCandleStick):
    @staticmethod
    def graph_method(df, title=None, save_fig=False, filename=None, output_base_dir=None):
        '''
        https://stackoverflow.com/a/65997291/15983717
        '''
        # plotly = go.Figure(data=go.Candlestick(x=df.index, open=df.open, high=df.high, low=df.low, close=df.close))
        # Plot OHLC on 1st row
        plotly = make_subplots(shared_xaxes=True, rows=2, cols=1,
                               vertical_spacing=0.03, subplot_titles=('OHLC', 'Volume'),
                               row_width=[1.0, 1.0])
        plotly.add_trace(
            go.Candlestick(
                x=df.index, open=df.open, high=df.high, low=df.low, close=df.close,
                name='OHLC'
            ), row=1, col=1
        )
        # Bar trace for volumes on 2nd row without legend
        plotly.add_trace(
            go.Scatter(x=df.index, y=df.volume, showlegend=False),
            row=2, col=1
        )
        plotly.update(layout_xaxis_rangeslider_visible=True)
        if save_fig:
            plotly.update_layout(
                xaxis=dict(
                    rangeslider=dict(
                        visible=False
                    ),
                )
            )
            plotly.update_yaxes(type='log')
            plotly.layout.yaxis2.showgrid = False
            plotly.write_image(
                f'{output_base_dir}/figure_{filename}.pdf', engine="kaleido", scale=10)
            #plotly.write_image(f'./figure_{filename}.png', engine="kaleido", scale = 20)
            plotly.update_layout(  # https://qiita.com/Ringa_hyj/items/b13e3e721519c2842cc9
                xaxis=dict(
                    rangeselector=dict(
                        buttons=list([
                            dict(count=1,
                                 label="1m",
                                 step="month",
                                 stepmode="backward"),
                            dict(count=6,
                                 label="6m",
                                 step="month",
                                 stepmode="backward"),
                            dict(count=1,
                                 label="YTD",
                                 step="year",
                                 stepmode="todate"),
                            dict(count=1,
                                 label="1y",
                                 step="year",
                                 stepmode="backward"),
                            dict(step="all")
                        ])
                    ),
                    rangeslider=dict(
                        visible=True
                    ),
                    type="date"
                )
            )
            save_html = False
            if save_html:
                plotly.write_html(f'{output_base_dir}/figure_{filename}.html')
            # https://zenn.dev/ganariya/articles/plotly-high-resolution
        else:
            plotly.show()
    # plotly_candlestick(convert_into_ohlcv(df.sort_index().loc['2022-08-01':'2022-08-07', :], '1min'))